- Fact Sheet
Immigrants in Rhode Island
Published
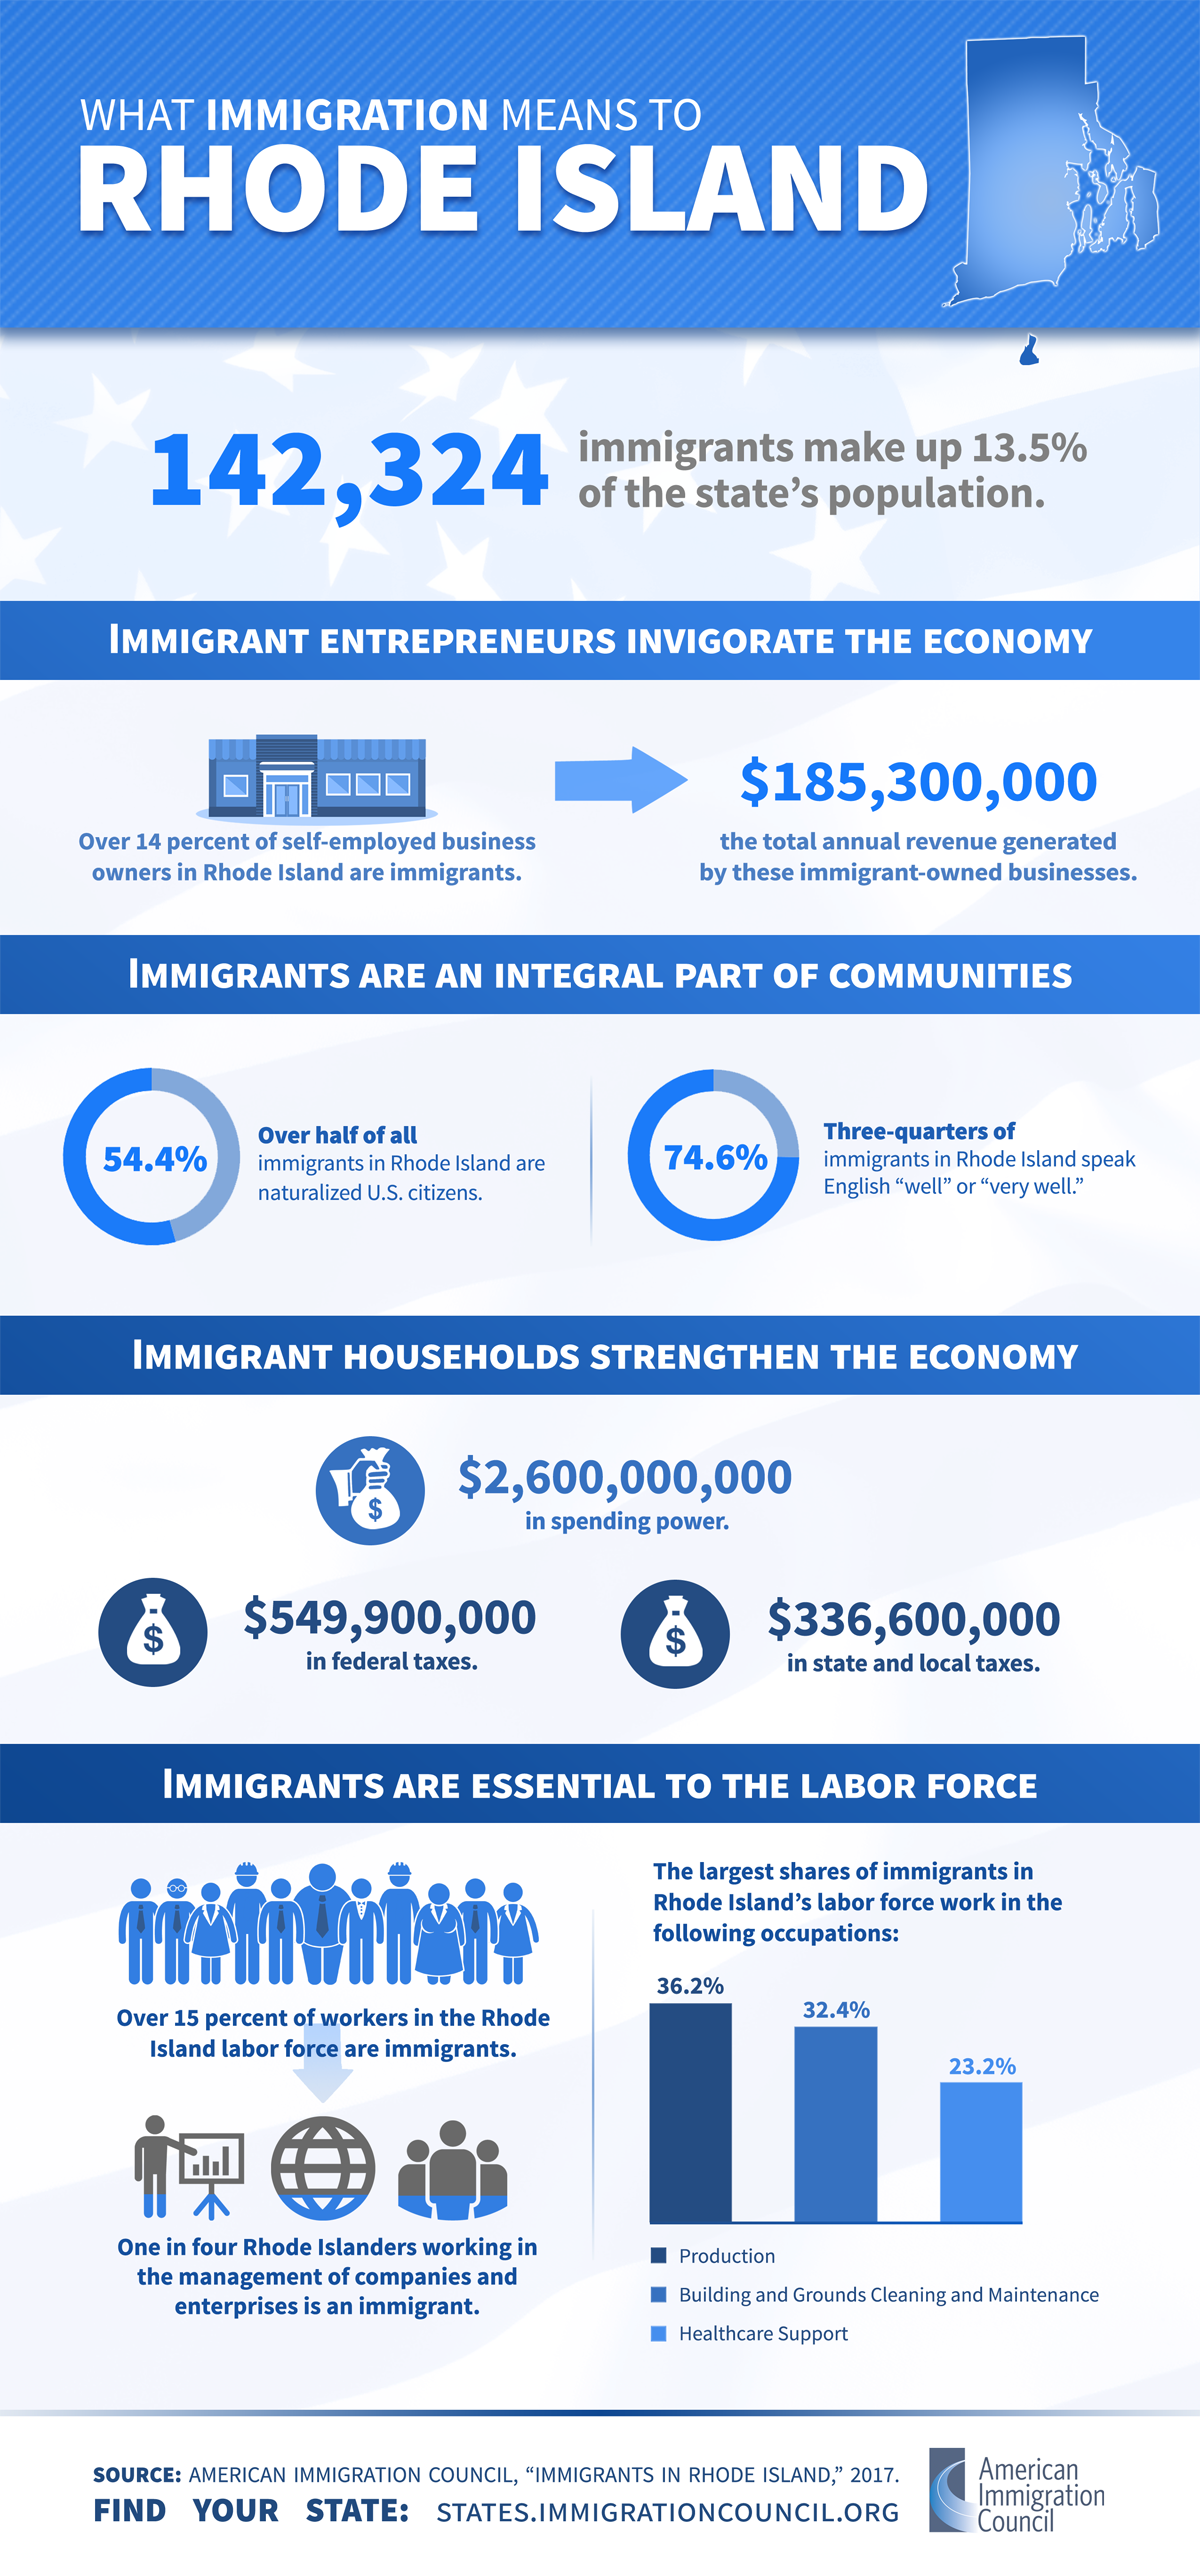
Rhode Island has a relatively large community of immigrants, many of whom emigrated from the Dominican Republic. One in eight Rhode Islanders was born in another country, while one in five residents is a native-born American who has at least one immigrant parent. The majority of immigrants speak English well and are naturalized citizens.
Rhode Island’s economy and labor force benefits from the active participation of immigrants, who comprise nearly two-fifths of workers in production occupations and one-third of workers in healthcare support occupations. As neighbors, business owners, taxpayers, and workers, immigrants are an integral part of Rhode Island’s diverse and thriving communities and make extensive contributions that benefit all.
One in eight Rhode Island residents is an immigrant, while about one in five residents is a native-born U.S. citizen with at least one immigrant parent.
- In 2018, 139,063 immigrants (foreign-born individuals) comprised 13 percent of the population.
- Rhode Island was home to 67,765 women, 63,685 men, and 7,613 children who were immigrants.
- The top countries of origin for immigrants were the Dominican Republic (19 percent of immigrants), Guatemala (10 percent), Portugal (7 percent), Cabo Verde (5 percent), and India (4 percent).
- In 2018, 201,216 people in Rhode Island (19 percent of the state’s population) were native-born Americans who had at least one immigrant parent.
Three out of five immigrants in Rhode Island are naturalized U.S. citizens.
- 84,365 immigrants (61 percent) had naturalized as of 2018, and 23,635 immigrants were eligible to become naturalized U.S. citizens in 2017.
- Over three-fourths (77 percent) of immigrants reported speaking English “well” or “very well.”
Immigrants in Rhode Island are distributed across the educational spectrum.
- More than one-fourth (27 percent) of adult immigrants had a college degree or more education in 2018, while one-fourth (25 percent) had less than a high school diploma.
|
Education Level |
Share (%) of All Immigrants |
Share (%) of All Natives |
|---|---|---|
|
College degree or more |
27 |
36 |
|
Some college |
18 |
28 |
|
High school diploma only |
30 |
28 |
|
Less than a high school diploma |
25 |
8 |
|
Source: U.S. Census Bureau, 2018 American Community Survey 1-Year Estimates. |
||
More than 18,000 U.S. citizens in Rhode Island live with at least one family member who is undocumented.
- 30,000 undocumented immigrants comprised 19 percent of the immigrant population and 3 percent of the total state population in 2016.
- 37,475 people in Rhode Island, including 18,465 U.S. citizens, lived with at least one undocumented family member between 2010 and 2014.
- During the same period, about 6 percent of children in the state were U.S. citizens living with at least one undocumented family member (12,541 children in total).
Rhode Island is home to hundreds of Deferred Action for Childhood Arrivals (DACA) recipients.
- 890 active DACA recipients lived in Rhode Island as of March 2020, while DACA has been granted to 1,168 people in total since 2012.
- As of 2019, 26 percent of DACA-eligible immigrants in Rhode Island had applied for DACA.
- Fewer than 1,000 residents of the state would satisfy all but the educational requirements for DACA, and fewer than 1,000 would become eligible as they grew older.
One in six Rhode Island workers is an immigrant, together making up a vital part of the state’s labor force.
- 90,131 immigrant workers comprised 16 percent of the labor force in 2018.
- Immigrant workers were most numerous in the following industries:
|
Industry |
Number of Immigrant Workers |
|---|---|
|
Health Care and Social Assistance |
18,438 |
|
Manufacturing |
17,458 |
|
Educational Services |
10,072 |
|
Administrative & Support; Waste Management; and Remediation Services |
8,111 |
|
Retail Trade |
7,675 |
|
Source: Analysis of the U.S. Census Bureau’s 2018 American Community Survey 1-year PUMS data by the American Immigration Council. |
|
- The largest shares of immigrant workers were in the following industries:
|
Industry |
Immigrant Share (%) |
|---|---|
|
Administrative & Support; Waste Management; and Remediation Services |
29 |
|
Manufacturing |
26 |
|
Health Care and Social Assistance |
19 |
|
Transportation and Warehousing |
18 |
|
Other Services (except Public Administration) |
15 |
|
Source: Analysis of the U.S. Census Bureau’s 2018 American Community Survey 1-year PUMS data by the American Immigration Council. |
|
Immigrants are an integral part of the Rhode Island workforce in a range of occupations.
- In 2018, immigrant workers were most numerous in the following occupation groups:
|
Occupation Category |
Number of Immigrant Workers |
|---|---|
|
Production |
14,646 |
|
Transportation and Material Moving |
9,151 |
|
Healthcare Support |
8,996 |
|
Office and Administrative Support |
8,717 |
|
Building and Grounds Cleaning & Maintenance |
8,529 |
|
Source: Analysis of the U.S. Census Bureau’s 2018 American Community Survey 1-year PUMS data by the American Immigration Council. |
|
- The largest shares of immigrant workers were in the following occupation groups:
|
Occupation Category |
Immigrant Share (%) |
|---|---|
|
Production |
38 |
|
Healthcare Support |
34 |
|
Building and Grounds Cleaning & Maintenance |
34 |
|
Community and Social Service |
21 |
|
Transportation and Material Moving |
20 |
|
Source: Analysis of the U.S. Census Bureau’s 2018 American Community Survey 1-year PUMS data by the American Immigration Council. |
|
- Undocumented immigrants comprised 4 percent of Rhode Island’s workforce in 2016.
Immigrants in Rhode Island have contributed over a billion dollars in taxes.
- Immigrant-led households in the state paid $681.8 million in federal taxes and $384.7 million in state and local taxes in 2018.
- Undocumented immigrants in Rhode Island paid an estimated $27.6 million in federal taxes and $19.9 million in state and local taxes in 2018.
- Rhode Island DACA recipients and DACA-eligible individuals paid an estimated $3.1 million in state and local taxes in 2018.
As consumers, immigrants add billions of dollars to Rhode Island’s economy.
- Rhode Island residents in immigrant-led households had $3 billion in spending power (after-tax income) in 2018.
Immigrant entrepreneurs in Rhode Island generate hundreds of millions of dollars in business revenue.
- 7,187 immigrant business owners accounted for 16 percent of all self-employed Rhode Island residents in 2018 and generated $280.7 million in business income.
- In 2018, immigrants accounted for 29 percent of business owners in the Providence/Warwick metropolitan area, which extends from Rhode Island into Massachusetts.